so if you were pushing very hard, we could use more memory than the determined soft limit
alright.. that softlimit can be set to 2Gb or more?
but I will build me the latest verzion and see if that makes a difference
the soft limit defaults to 75% of the physical ram, but you can explicitly set it via cgroup or ulimit
right got it… well I upped the server from 4Gb to 8Gb
in order to get memory out of the way
depending on how hard you’re pushing, 8gb might be a little tight. I’d definitely recommend running with that commit to keep things within the soft limit
I will give it a try with the webhook.
and this latest version
Build and installed kumomta-dev.2024.03.28.065631.1b451e3a.Debian12.deb, enabled the webhooks again… lets wait and see. Thanks for getting back on this @yearning-hyena
and ofc.. thanks @free-spirited-yorksh ![]()
@magnanimous-umbrella any update?
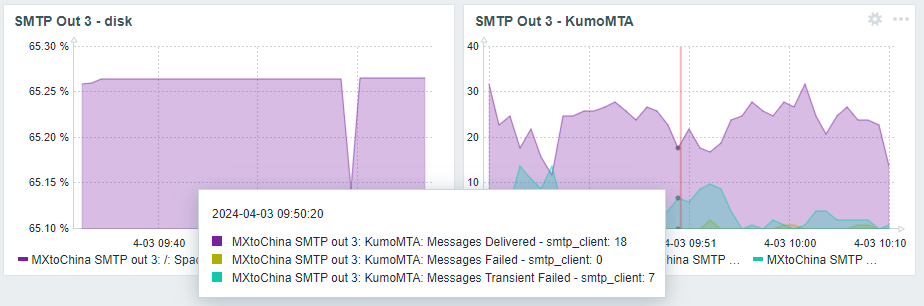
So far so good.. no lockups yet.. but sending volume have been fairly low the last 4 days. However I just see a sendout which is doing a 30 messages per minute, which is now fully served by Kumo and it is still serving.
Oh well the happy streak ended at 4:22 NL time. Last log in elastic is a Reception of a mail and in the ‘tailer --tail’ of the kumo logs I see the delivery, which did not make it into logstash:
  "type": "Delivery",
  "id": "0c7c5056f16111ee94ca02666fd40793",
  "sender": "return-to@news.bla.com",
  "recipient": "a.b.c@blabla.com",
  "queue": "webhook.log_hook",
  "site": "unspecified->webhook.log_hook@lua:make.webhook.log_hook",
  "size": 680,
  "response": {
    "code": 200,
    "enhanced_code": null,
    "content": "200 OK: ok",
    "command": null
  },
  "peer_address": {
    "name": "Lua via make.webhook.log_hook",
    "addr": "0.0.0.0"
  },
  "timestamp": 1712110961,
  "created": 1712110961,
  "num_attempts": 0,
  "bounce_classification": "Uncategorized",
  "egress_pool": "unspecified",
  "egress_source": "unspecified",
  "feedback_report": null,
  "meta": {},
  "headers": {},
  "delivery_protocol": "Lua",
  "reception_protocol": "LogRecord",
  "nodeid": "234f64a1-0345-419b-a259-8aad0bbf8ea3"
}
It simply stops responding ![]() Looking at memory usage it says that there is 5Gb is still available in zabbix. Systemctl shows: Memory: 836.4M
Looking at memory usage it says that there is 5Gb is still available in zabbix. Systemctl shows: Memory: 836.4M
Actually it was doing like 50 mails per minute. Logstash had double the amount to handle.. but usually logstash should be capable of that. But for the sake of science I now removed the webhook and will rely on my zabbix monitoring to detect if Kumo still runs. I am a little lost on what this can be.. Can’t be memory on the server.
Oh well since I am now all in monitoring using te metrics.json.. I noticed that when the connection queue info fills up with domain entries.. I don’t see the memory values anymore in the json info.
Are you saying that the json is incomplete? How many domain entries are we talking about here? Is the regular prometheus data from /metrics complete in that situation?
Can you post the full conf? It will help with troubleshooting.
Additionally, if/when it is next locked up, please obtain a stack trace. You need lldb for this.
$ lldb -p $(pgrep kumod) -o 'bt all' -o 'quit' > /tmp/kumo-bt.txt
then provide the /tmp/kumo-bt.txt file to us