Problem:
I’m seeing the following error in the logs:
```
logging-1 kumo_api_types::shaping: reading text from http://127.0.0.1:8008/get_config_v1/shaping.toml: error decoding response body: request or response body error: operation timed out. Ignoring this shaping source for now
Before upgrading, everything worked fine.

When this error occurs, if I manually run
<U+2068>```
curl http://127.0.0.1:8008/get_config_v1/shaping.toml
```<U+2069>
it returns immediately without any delay. (The returned content is correct.)

After I restarted the TSA service, it returned to normal.

Any idea what could be causing this timeout or decoding issue after the upgrade?

---
I really didn’t change anything else in the configuration file—almost everything is still the example content. My setup is very simple. It worked fine before the upgrade, but this issue has occurred twice since upgrading.
```
logging-0 mod_memoize: shaping_data (Some(ConfigEpoch(16369)), "[["/opt/kumomta/share/policy-extras/shaping.toml","/opt/kumomta/share/policy-extras/shaping.toml","/opt/kumomta/share/community/shaping.toml","/opt/kumomta/etc/policy/shaping_custom.toml","http://127.0.0.1:8008/get_config_v1/shaping.toml\“],null]”) failed: shaping_data lookup for (Some(ConfigEpoch(16369)), "[["/opt/kumomta/share/policy-extras/shaping.toml","/opt/kumomta/share/policy-extras/shaping.toml","/opt/kumomta/share/community/shaping.toml","/opt/kumomta/etc/policy/shaping_custom.toml","http://127.0.0.1:8008/get_config_v1/shaping.toml\“],null]”) timed out after 120s on semaphore acquire while waiting for cache to populate
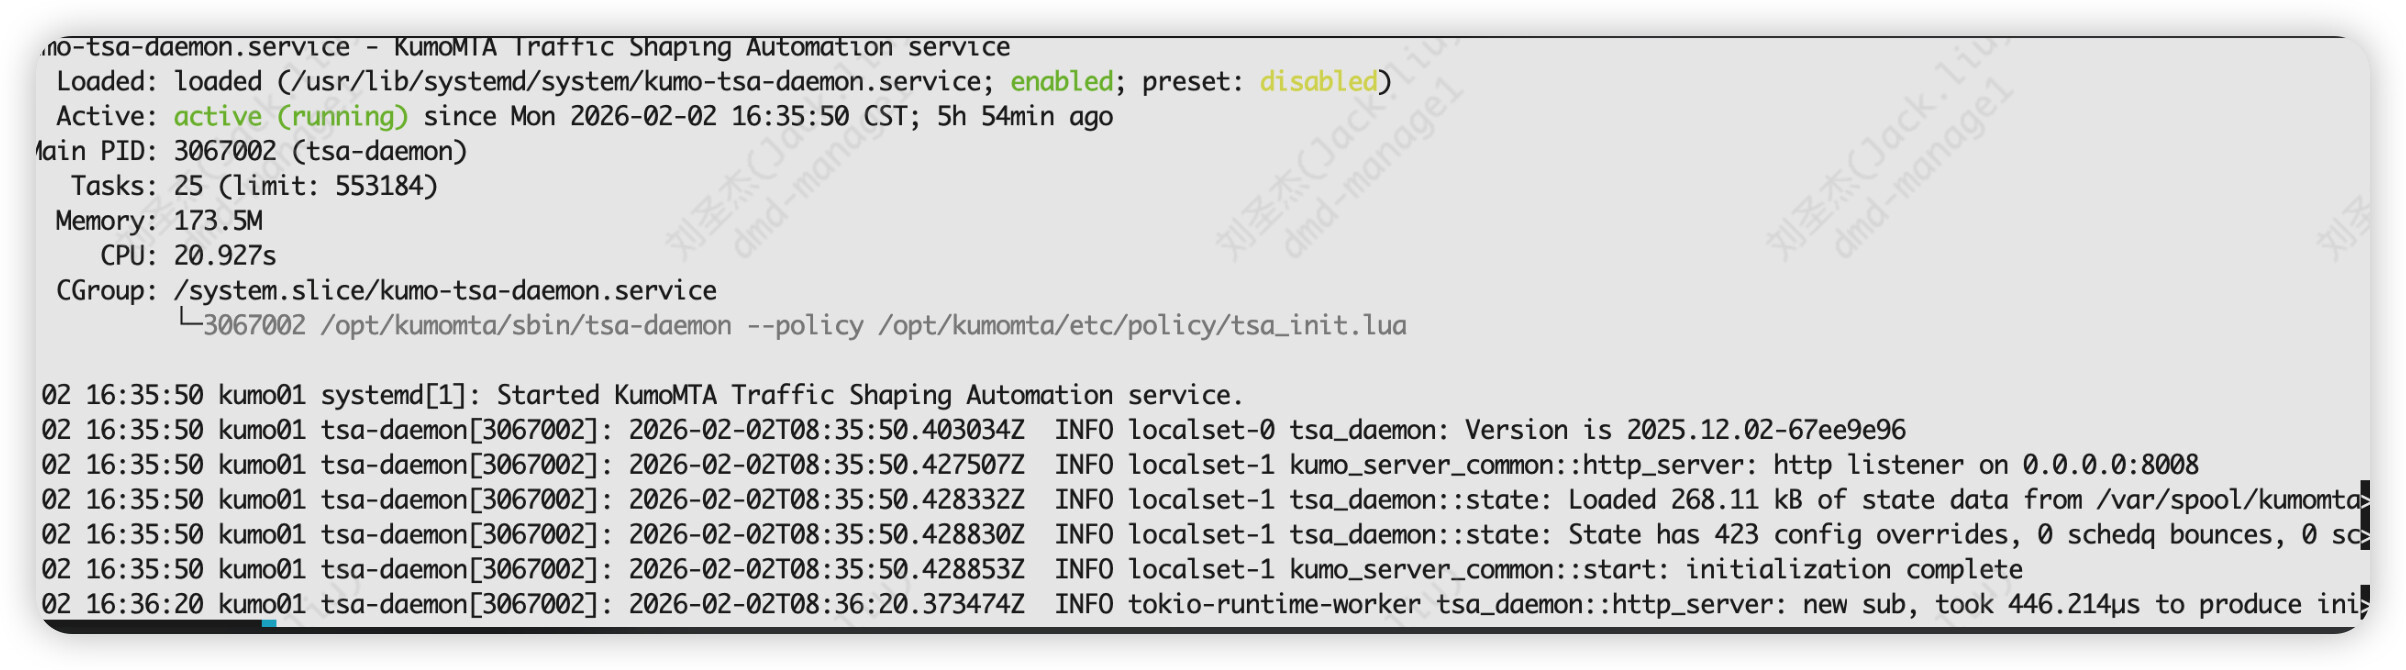
Yes, it’s intermittent. It works fine after a restart, but after some time (the interval is not fixed), the issue reappears. Then, even without restarting, the errors stop after about 1–2 minutes. I haven’t found any pattern yet. Also, the kumo-tsa service doesn’t show any errors.
Trying 127.0.0.1:8008…
% Total % Received % Xferd Average Speed Time Time Time Current
Dload Upload Total Spent Left Speed
0 0 0 0 0 0 0 0 --:–:-- --:–:-- --:–:-- 0* Connected to 127.0.0.1 (127.0.0.1) port 8008 (#0)
GET /get_config_v1/shaping.toml HTTP/1.1
Host: 127.0.0.1:8008
User-Agent: curl/7.76.1
Accept: /
Mark bundle as not supporting multiuse
< HTTP/1.1 200 OK
< content-type: text/plain; charset=utf-8
< vary: accept-encoding
< content-length: 107882
< date: Mon, 02 Feb 2026 14:45:09 GMT
<
{ [33136 bytes data]
100 105k 100 105k 0 0 10.2M 0 --:–:-- --:–:-- --:–:-- 10.2M
If the issue were really caused by the tsa service crashing, then executing
curl http://127.0.0.1:8008/get_config_v1/shaping.toml
should also yield no response. However, every time I test it, it responds quickly.
My other guess is about actual content. The error error decoding response body: request or response body error: operation timed out. implies that curl can’t parse the response from the request so it could be that part of the returned response actually breaks the output.
I think my testing strategy would be to periodically run the curl and when there is an error, check your logs for transfails that happen at the same time, perhaps with a script. My guess is that you are hitting a transfail that triggers a rule that contains characters that break the output.
Alternately, you may want to run curl verbose so you can see the entire transaction and when it breaks, it might actually show you what broke it. ( add a -v)
Interesting, but a restart should not be required. I’d like to get to the bottom if that weirdness. Can I ask a few questions?
Is tsa daemon and kumod on the same server?
If not, are they both on the same version of Kumo?
What is the host profile? (CPU, RAM, Drive, NIC)
Are there other services running on it that may be using ports 25 and 8008
Are you also running Prometheus and Grafana on that host?
Can you share your sysctl settings for :
vm.max_map_count
net.core.rmem_default
net.core.wmem_default
net.core.rmem_max
net.core.wmem_max
fs.file-max
net.ipv4.ip_local_port_range
net.ipv4.tcp_tw_reuse
kernel.shmmax
net.core.somaxconn
vm.nr_hugepages
kernel.shmmni