Name:    kumod
Umask:    0022
State:    S (sleeping)
Tgid:    303271
Ngid:    0
Pid:    303271
PPid:    1
TracerPid:    0
Uid:    0    995    0    995
Gid:    993    993    993    993
FDSize:    8192
Groups:
NStgid:    303271
NSpid:    303271
NSpgid:    303271
NSsid:    303271
VmPeak:    61334844 kB
VmSize:    61334844 kB
VmLck:           0 kB
VmPin:           0 kB
VmHWM:    41354312 kB
VmRSS:    18906316 kB
RssAnon:    18864148 kB
RssFile:       42168 kB
RssShmem:           0 kB
VmData:    61257144 kB
VmStk:         132 kB
VmExe:       44872 kB
VmLib:        6008 kB
VmPTE:      111732 kB
VmSwap:           0 kB
HugetlbPages:           0 kB
CoreDumping:    0
THP_enabled:    1
Threads:    62
SigQ:    1/257056
SigPnd:    0000000000000000
ShdPnd:    0000000000000000
SigBlk:    0000000000000000
SigIgn:    0000000000001000
SigCgt:    0000000100004443
CapInh:    0000000000000000
CapPrm:    0000000000000400
CapEff:    0000000000000400
CapBnd:    000001ffffffffff
CapAmb:    0000000000000000
NoNewPrivs:    0
Seccomp:    0
Seccomp_filters:    0
Speculation_Store_Bypass:    not vulnerable
SpeculationIndirectBranch:    always enabled
Cpus_allowed:    ffff
Cpus_allowed_list:    0-15
Mems_allowed:    00000000,00000000,00000000,00000000,00000000,00000000,00000000,00000000,00000000,00000000,00000000,00000000,00000000,00000000,00000000,00000000,00000000,00000000,00000000,00000000,00000000,00000000,00000000,00000000,00000000,00000000,00000000,00000000,00000000,00000000,00000000,00000001
Mems_allowed_list:    0
voluntary_ctxt_switches:    54
nonvoluntary_ctxt_switches: 0```also fyi, a added the sysctl optimizations from your docs:
net.core.rmem_default=32768
net.core.wmem_default=32768
net.core.rmem_max=262144
net.core.wmem_max=262144
fs.file-max=250000
net.ipv4.ip_local_port_range=1024 63000
net.ipv4.tcp_tw_reuse=1
kernel.shmmax=68719476736
net.core.somaxconn=1024
vm.nr_hugepages=20
kernel.shmmni=4096```does this have some effect as this also changes from memory settings
0,00 Mb COMMAND
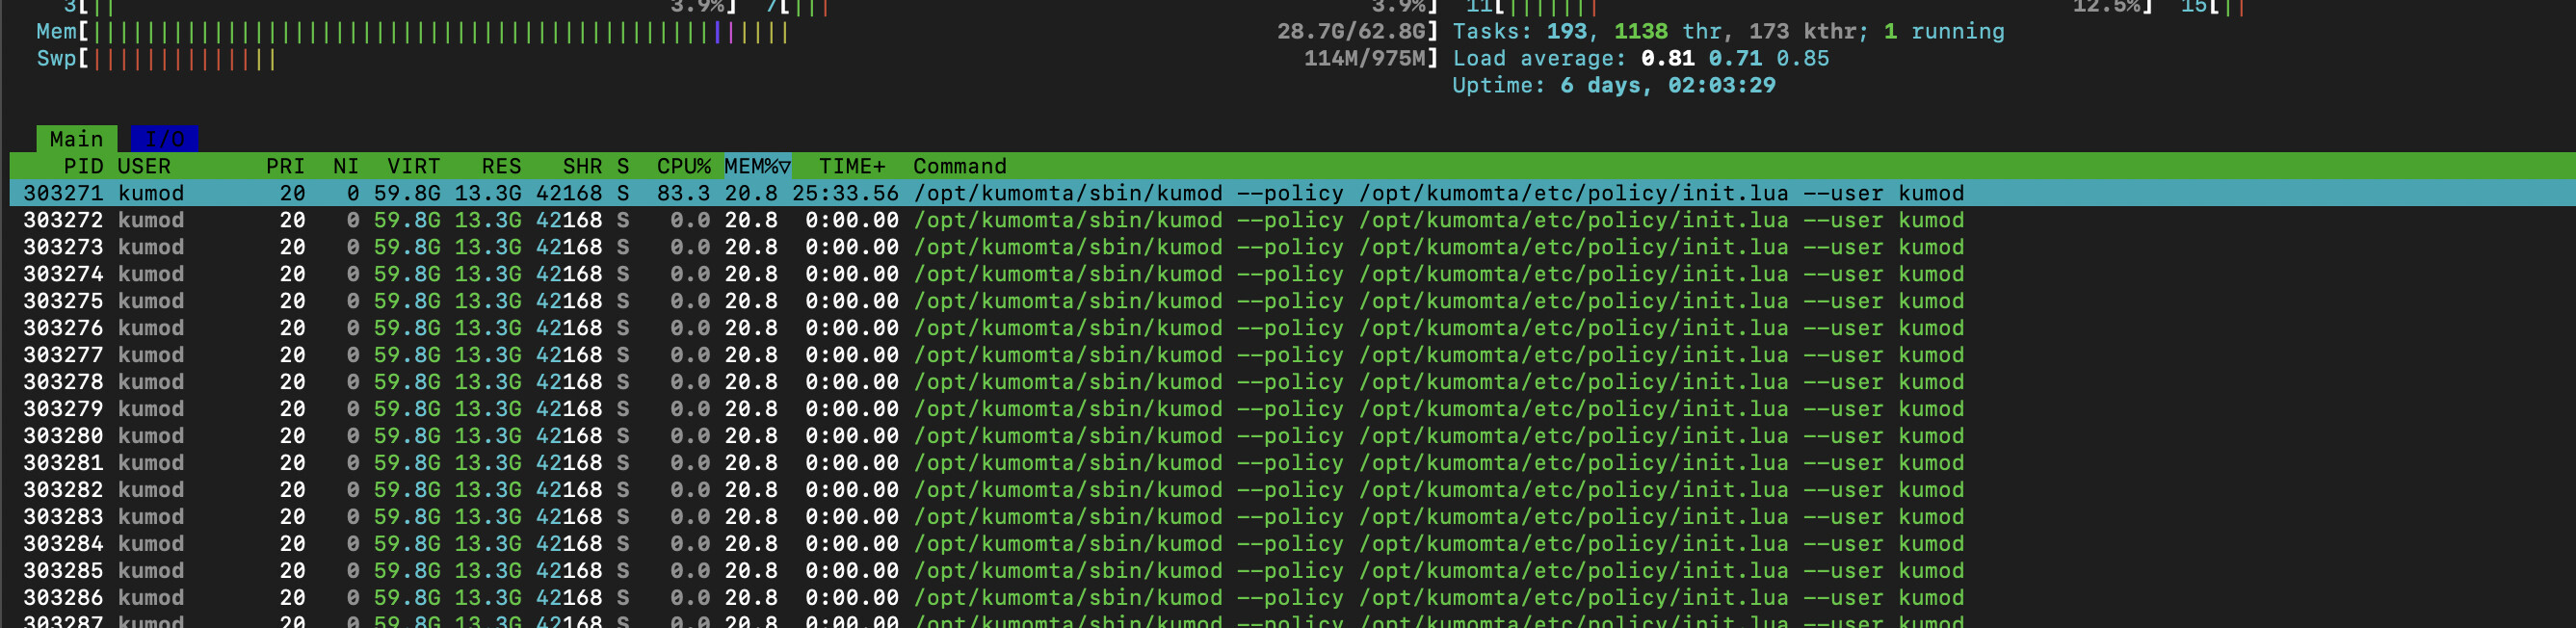
59931,04 Mb /opt/kumomta/sbin/kumod
1599,53 Mb /usr/bin/dockerd
so this is like the virtual memory allocation
Some of those settings may be hurting more than helping. You may want to revert that sysctl and do the calculations first. Hugepages in particular may not be useful here.
You also might check to see if other processes are using the ports you have framed out above.
Can we also get a dump from curl -s 'http://127.0.0.1:8000/metrics' so that we can see all of the counters for your system?
Are you saying that applying the sysctl’s fixed the RSS reporting?
metrics.log (1.9 MB)
nope, it was already before. just wanted to say that it was already there
I’m wondering if it’s possible to implement memory usage metrics? Having those for lua contexts, resident messages, etc., would help in pinpointing the cause of cases like this
Yes, these all exist today in the metrics
maybe in a -dev build? ```curl -s ‘http://127.0.0.1:3080/metrics’ | grep memory
HELP memory_limit soft memory limit measured in bytes
TYPE memory_limit gauge
memory_limit 253277626368
HELP memory_usage number of bytes of used memory
TYPE memory_usage gauge
memory_usage 4799668224```
they’ve been in the product for a long time
what are they called? Grepping metrics gives only memory_limit / memory_usage
^^ can you please spawn a separate question for this?