sure
so seams not to be related
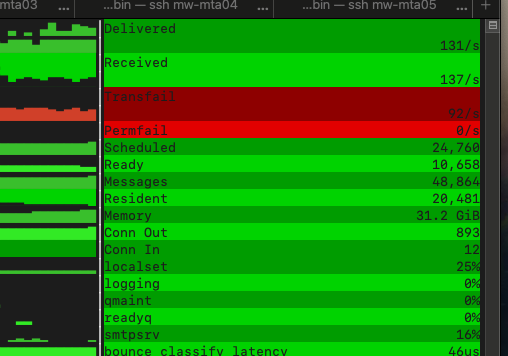
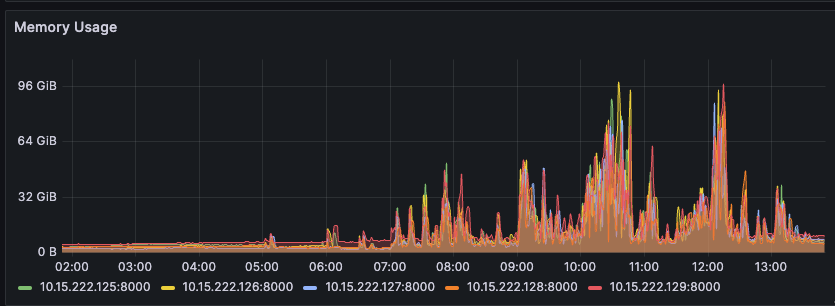
Interesting. That does seem like an large amount of memory. basically 1Gb per queued message, which seems extreme.
Looking into some better memory metrics we can use.
I think you shared before that you have this in your logging config:
max_segment_duration = '10 seconds',
Can you please change that to 5 minutes and restart the service?
I have some other ideas, but would like to see the result of that change first.
also, try running the validation tool and let me know if you see any errors:
sudo /opt/kumomta/sbin/kumod --validate --user kumod
sure, will do it today on one server. how do you see it regarding using AMQP to publish the logs? thats actually the reason i have 10 seconds. we process each files log files and report them to our backend.
That setting was in your local log config. It writes to disk only. If you are planning to scrape logs to AMQP then you may want to batch your AMQP script to run every 5 minutes on available logs. They will become readable after the segment duration expires.
However, we can write directly to AMQP so you don’t have to deal with the complexity of log scraping.
i discussed that with my team and we will implement that after my vacation that starts monday.
Any fun vacation plans?
@quintessential-camel are you deployed on x86 or Arm ?
x86
nothing special, hanging out on the beach, having some time with kids
@faithful-ostrich fyi: i changed to settings now to 5 minutes and see what will happen. also added amqp in order to process the status informations for my application. gonna let u guys know how it behaves.
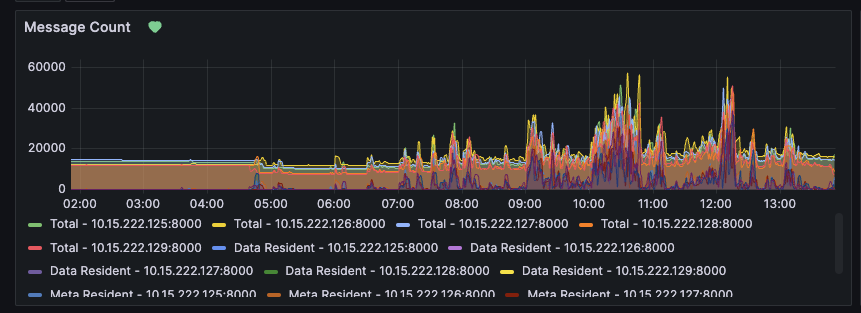
in general it looks much more better. we still see peaks but it correlates most of the times with enqueuing messages from outside. i only have one question for your local test setup. how do you inject the messages. by http oder smtp connection?
We test with both.
In my particular testing I was using SMTP.
thank you. like i said, looks much better now. i would see this topic as closed ![]()